Maps Showroom

Recognise geographical relationships at a glance

PTV data can be used to clearly visualise a wide variety of spatial connections and relationships in map displays.

Let our example maps inspire you.

Contact us now

Dynamic Demographics

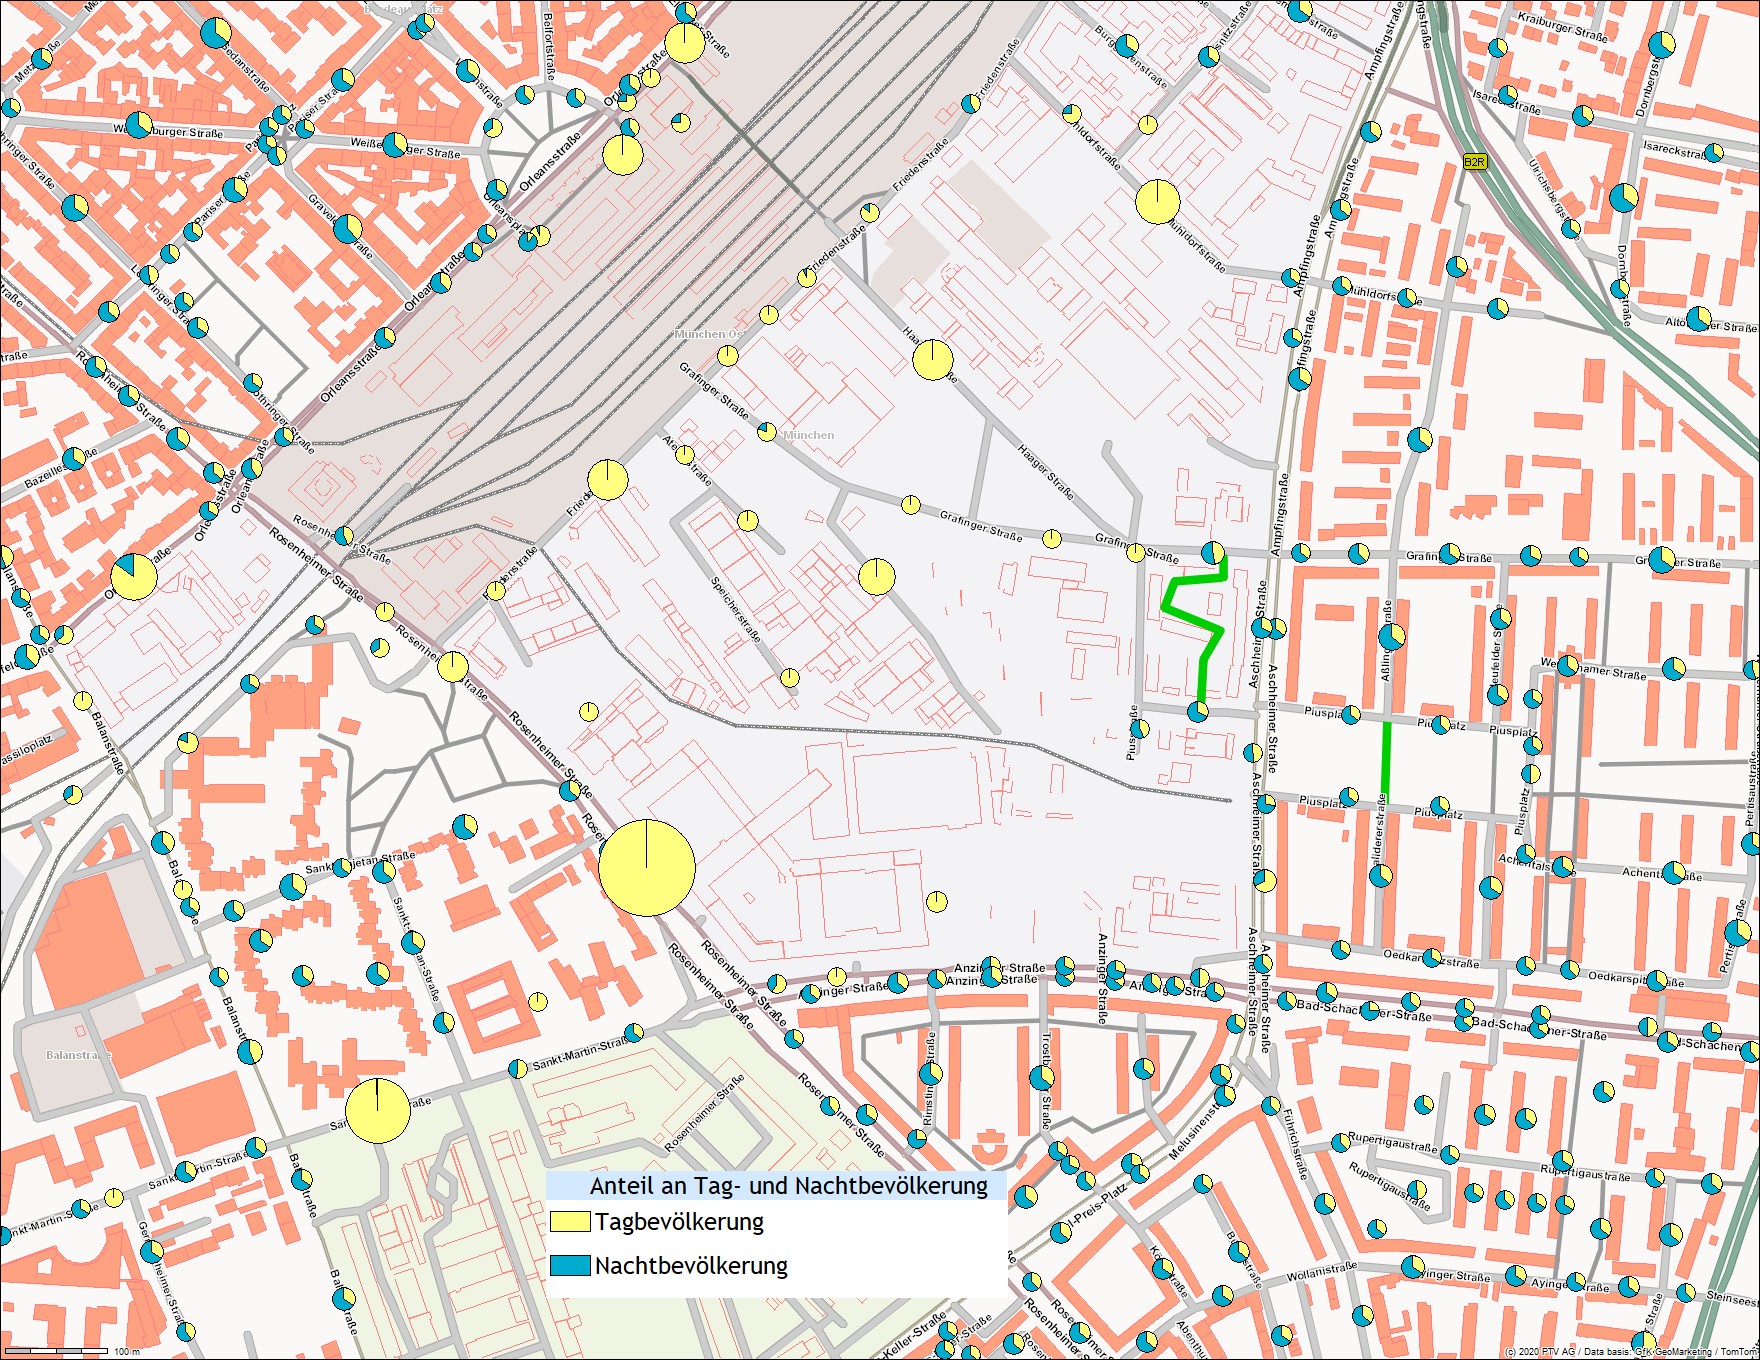
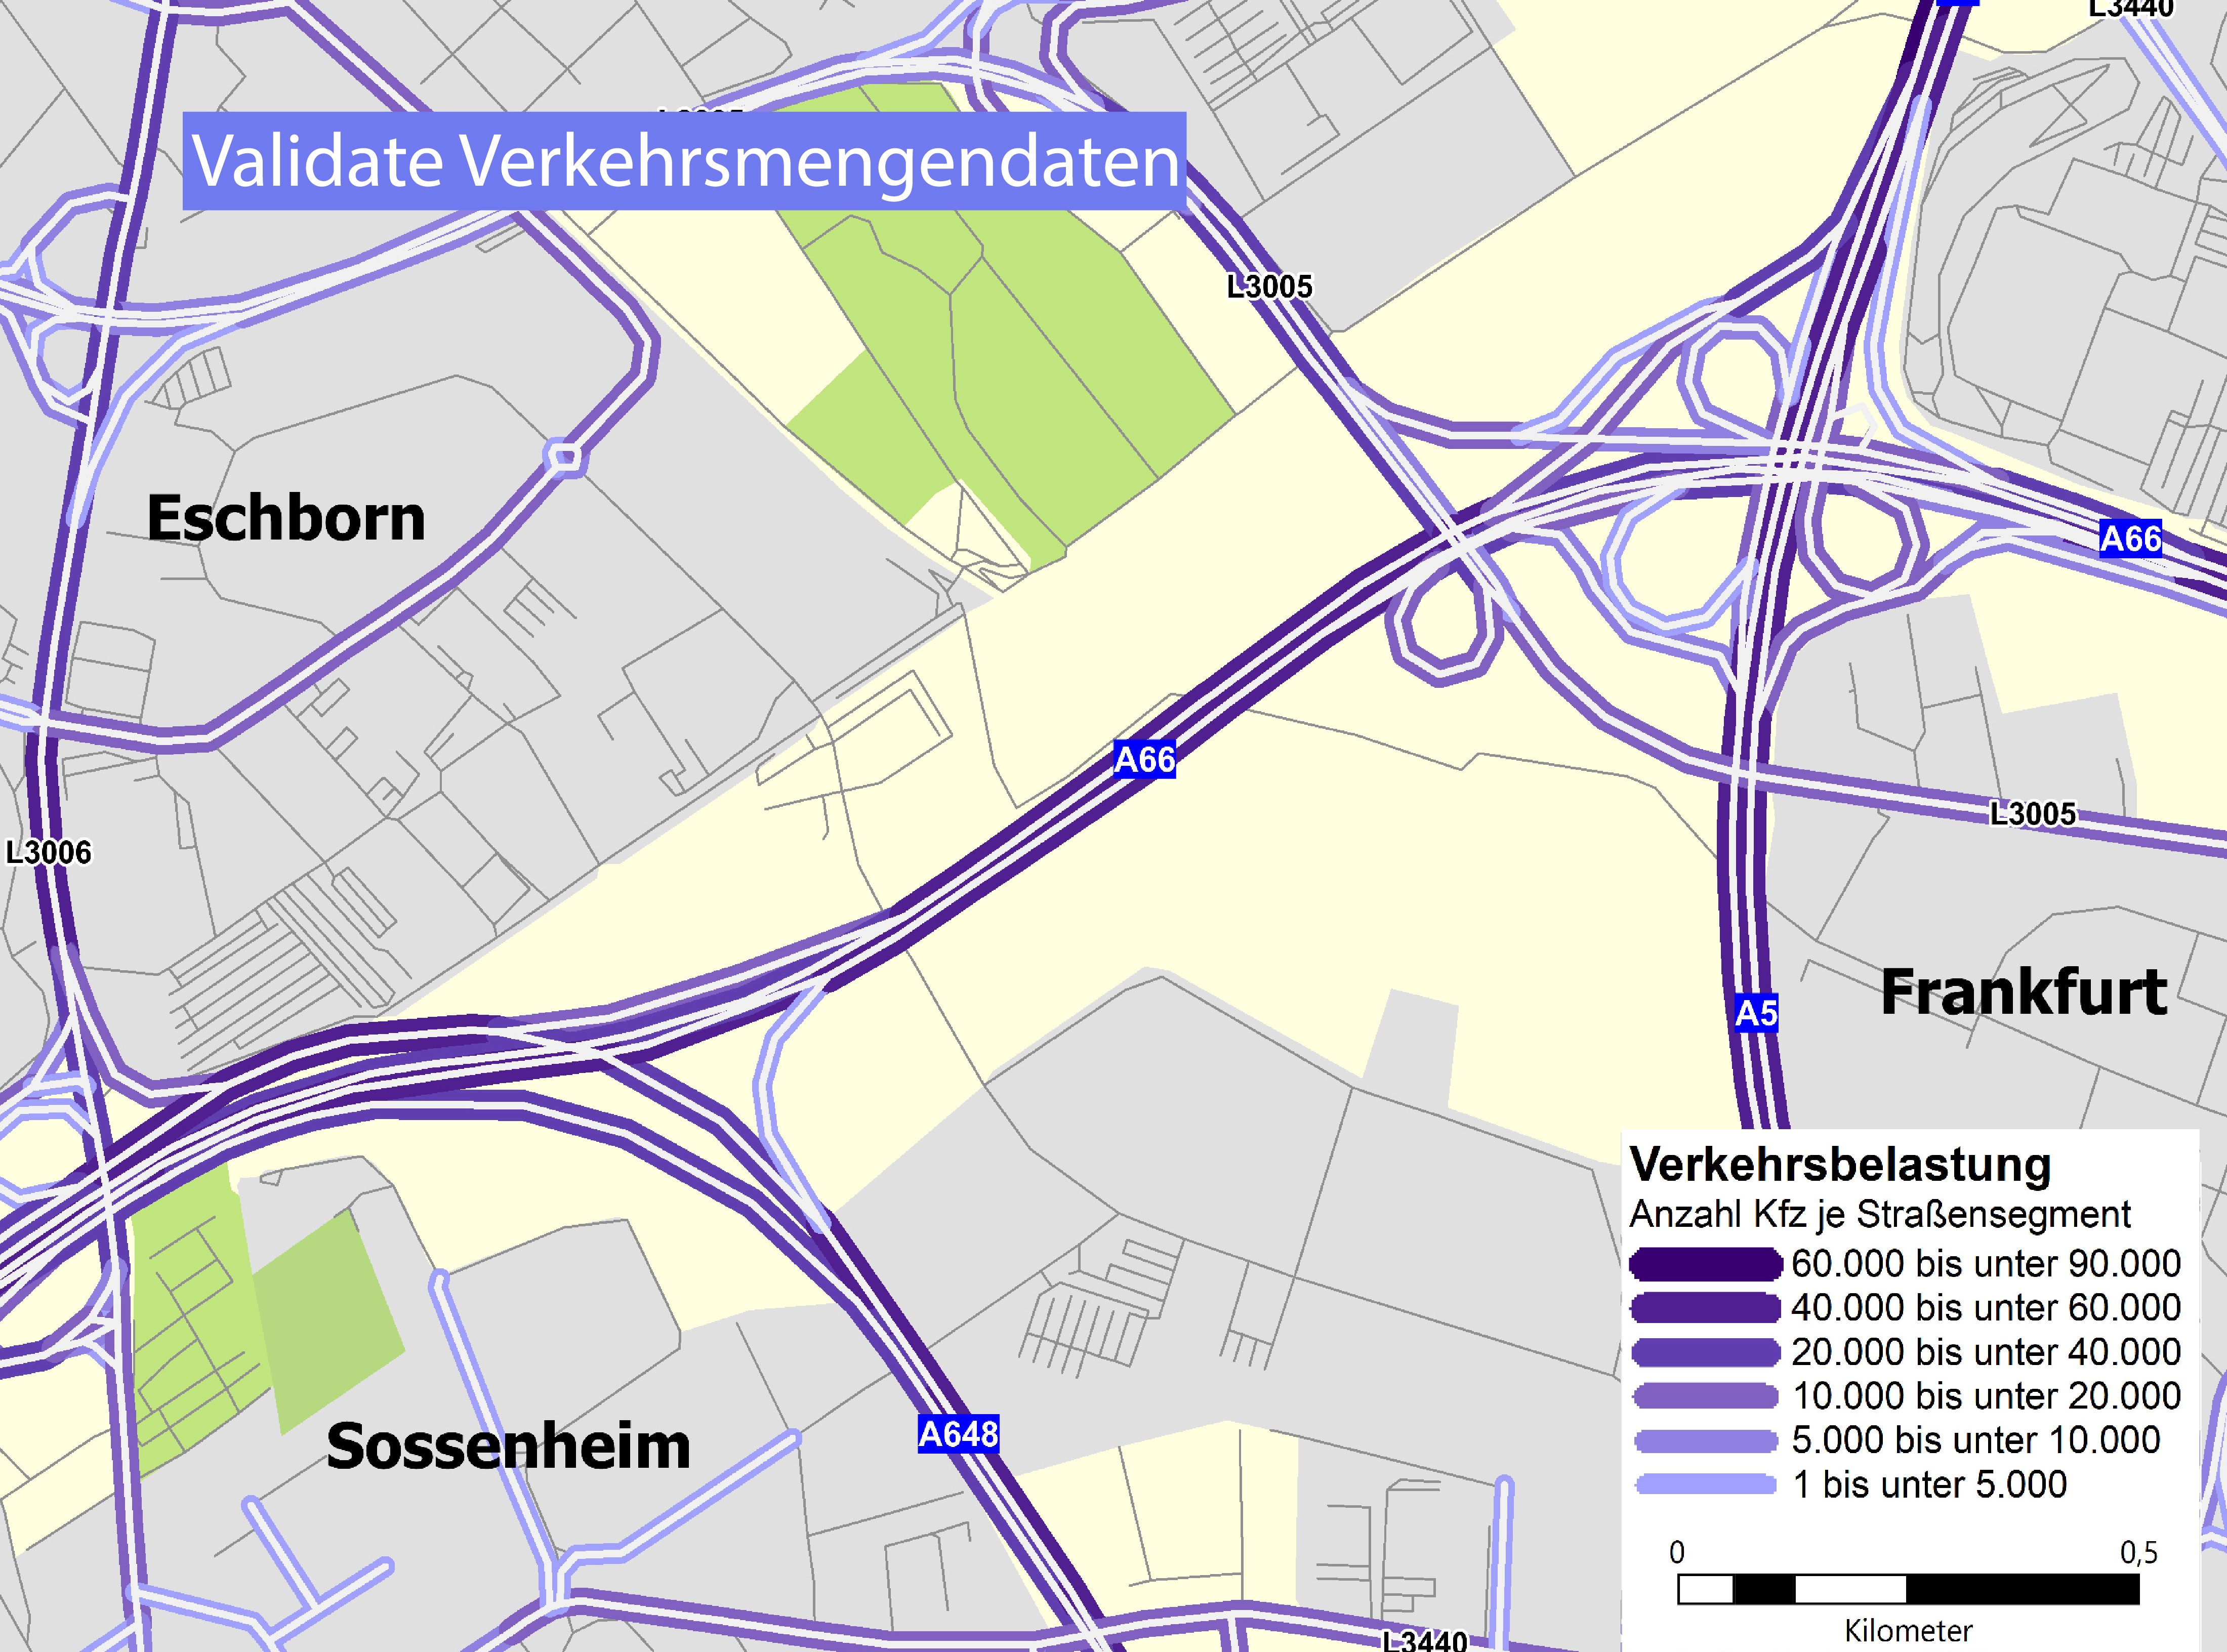
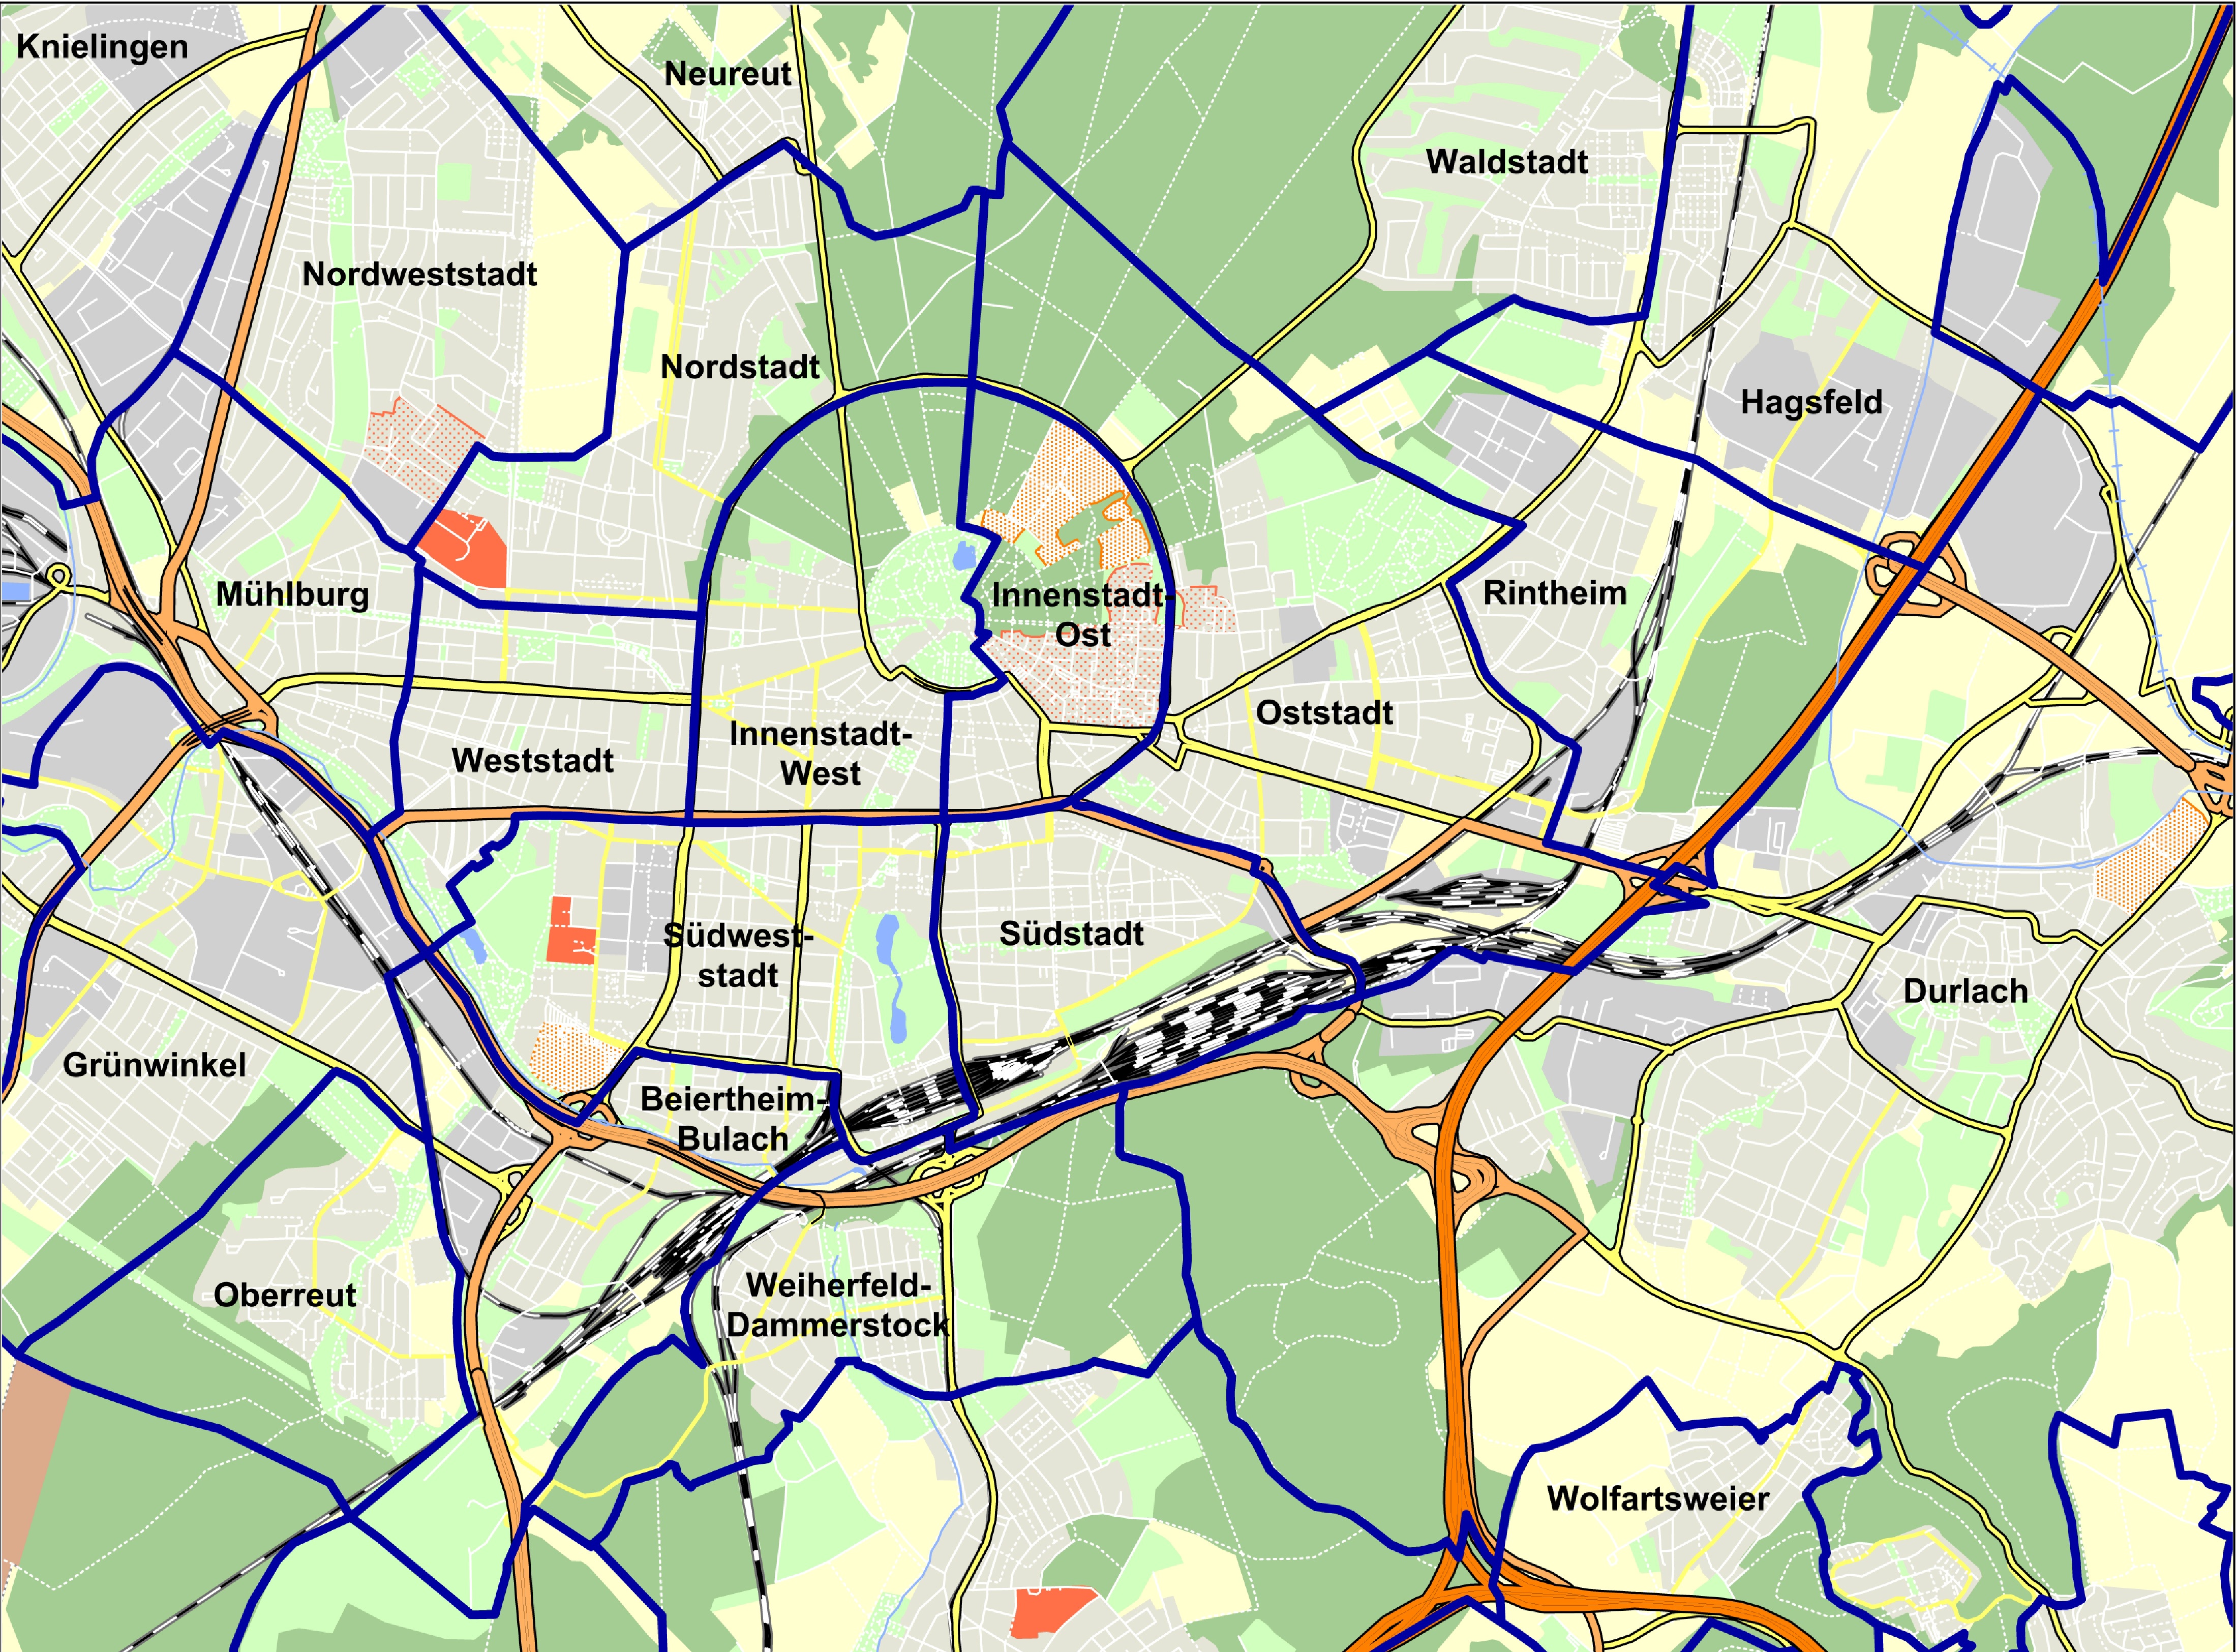
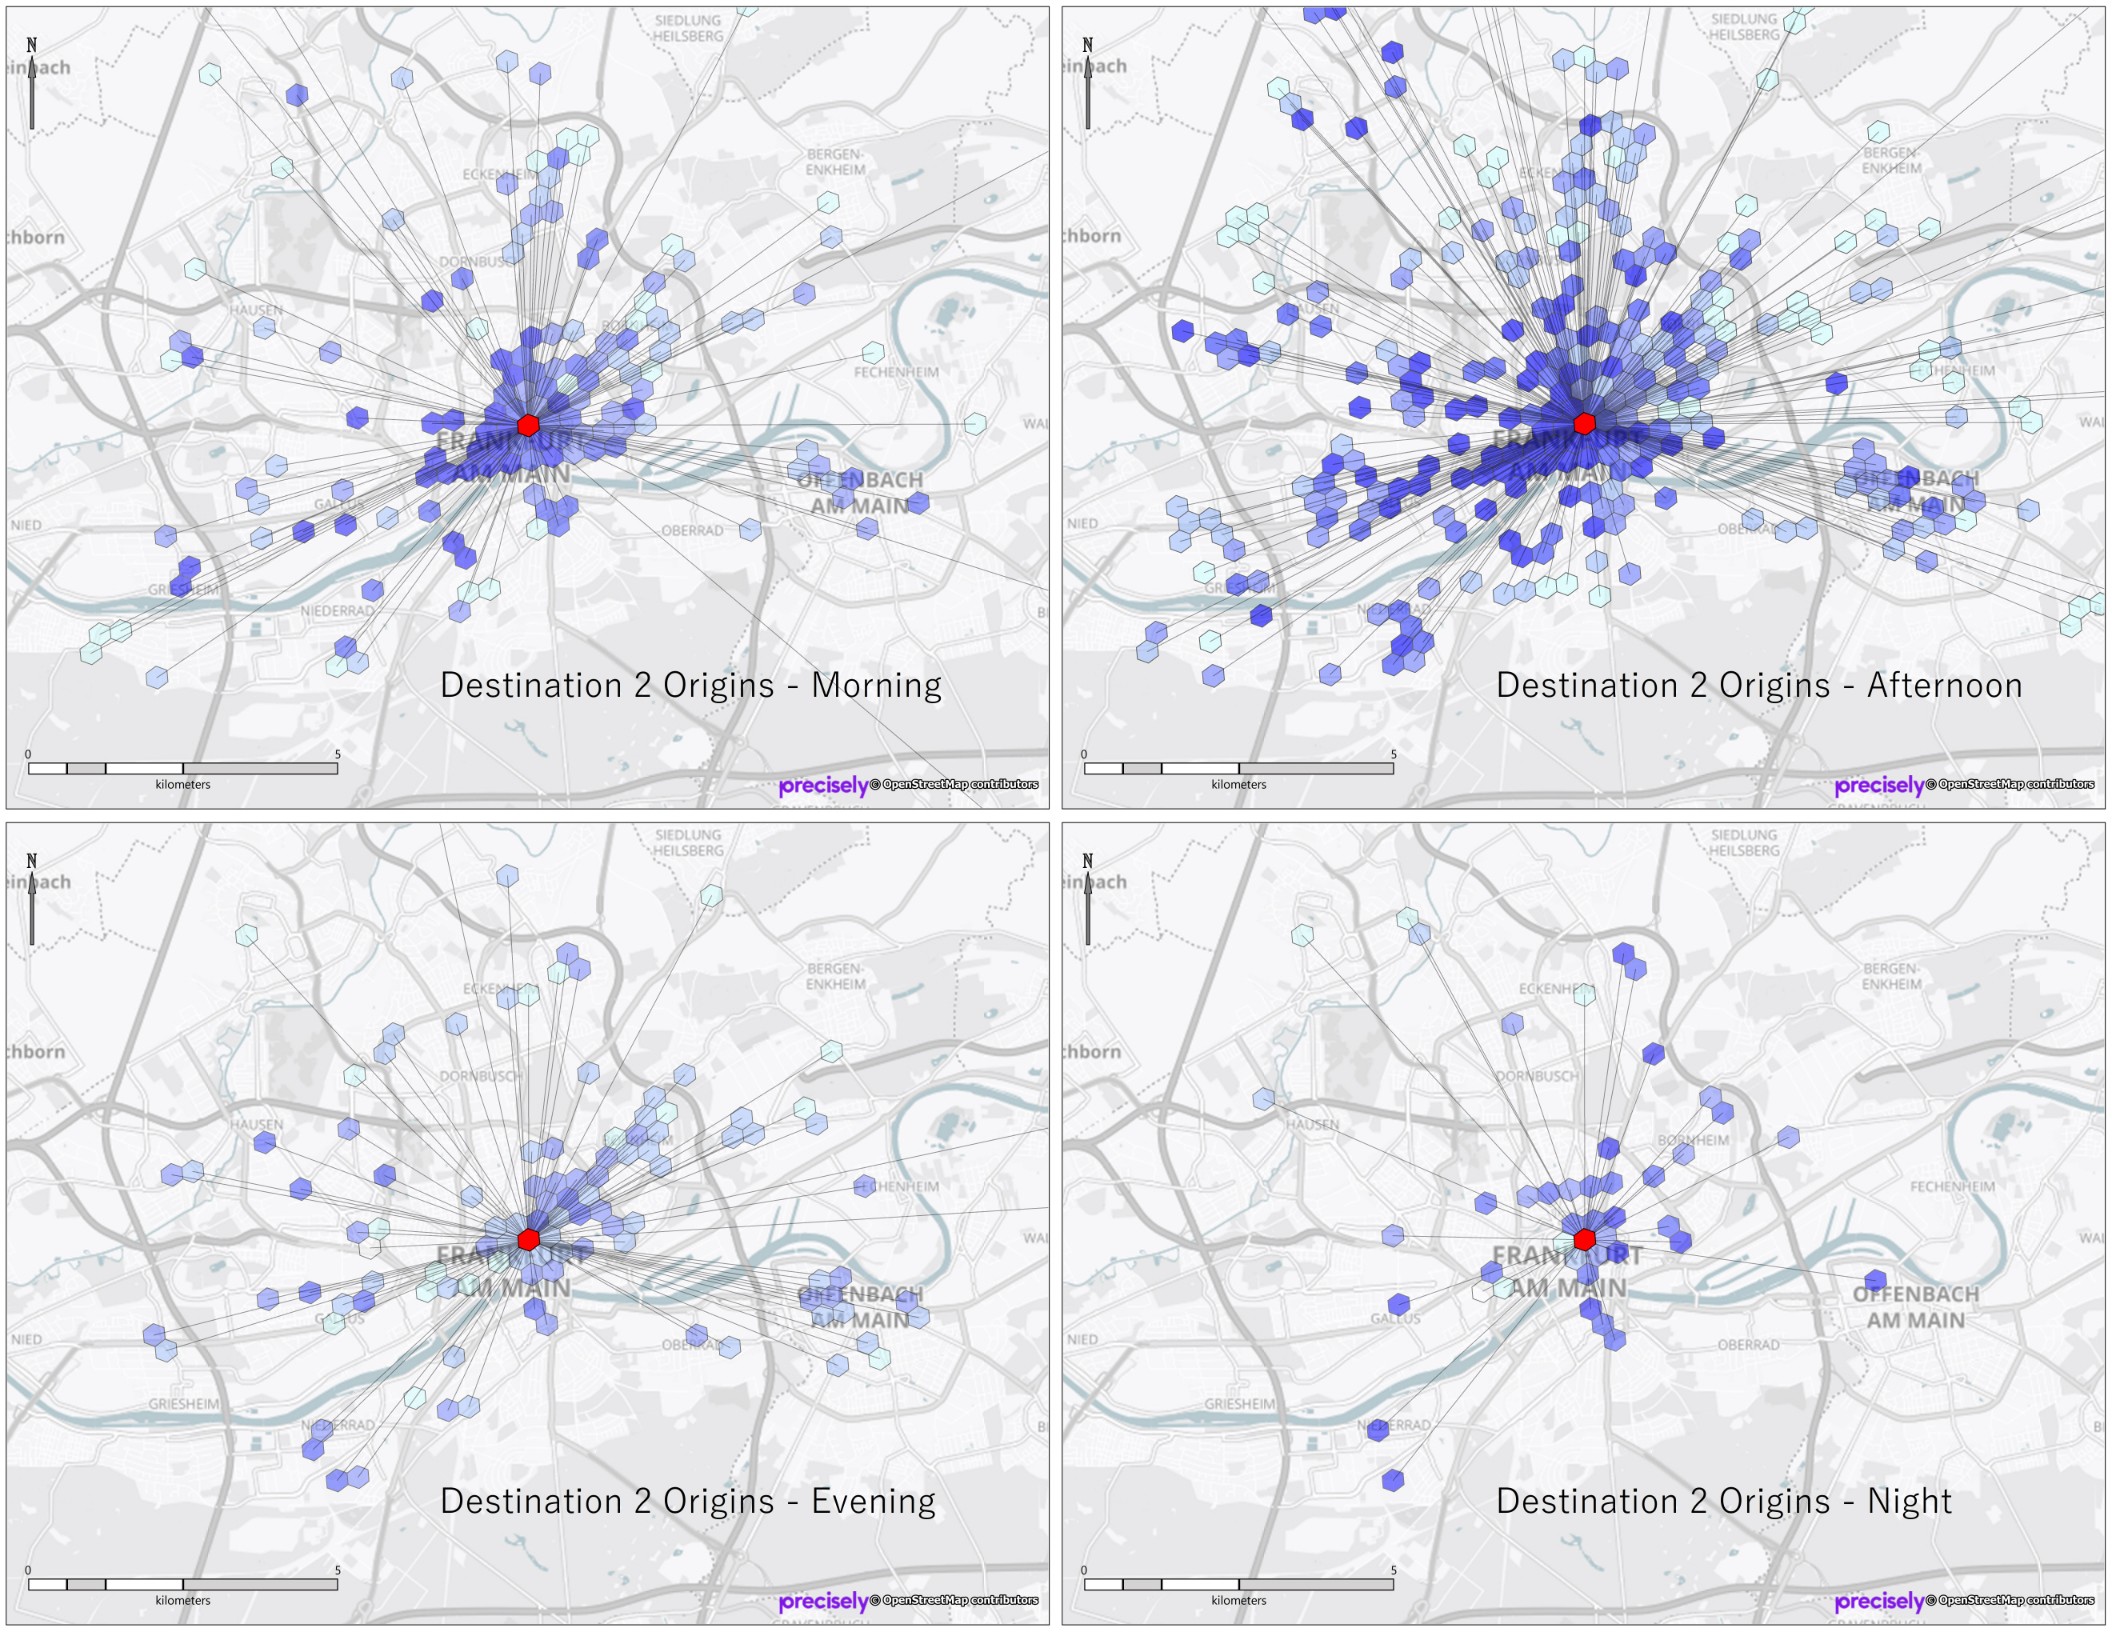
Commuter traffic flows based on the time of day

The four maps show the traffic flows of working women between the ages of 25 and 34 who commute from their place of residence (“Origin”) to their workplace in Frankfurt (“Destination”).

The basis of this is the dynamic demographics data supplied by our partner precisely. It can be used to depict commuter traffic specific to the time of day according to the population as a whole, but also divided according to categories such as gender, age or consumer style and lifestyle.

Copyright:

2022 precisely / PTV Planung Transport Verkehr GmbH

Residents, commuters and tourists

Population during day and night at street segment level

The map shows the population during the day and night at the street segment level. Night population values indicate how many people live in the area. The daytime population includes all people who spend time in the area during the day, therefore also taking commuters and tourists into account. City centres are usually characterised by a predominance of daytime population, while purely residential areas are characterised by a larger nighttime population.

Copyright:

2022 PTV Planung Transport Verkehr GmbH / Acxiom Deutschland GmbH